Posted on

Even Flow

Framework by Troy Schubert

Polarities live as interdependent pairs that need each other to exist, for example inhaling & exhaling.  One pole is not valued as better than the other.  Polarities have an enduring quality, they are unavoidable and unsolvable.  Polarities live everywhere from our internal dialogue to external patterns of relating in society and within organizations.  Overfocus on any one pole leads to the breakdown of the system as a whole.

Object of play
Simplify complex problems by identifying underlying patterns of tension in the system called polarities. Striking a dynamic balance between seemingly competitive forces – accomplished by observing and analyzing the paradox with a BOTH/AND lens – unlocks benefits otherwise concealed by the system.

Number of players
1-20

Invite players who are part of the system you would like to study.  This game can be played as an individual examining one’s internal landscape or external environment, or invite players from across your project team or larger organization.

Even Flow facilitated online during a Gamestorming community meeting. Click the image to explore the live Miro board.

Duration of play
1 – 4 hours

Material required
To run a good session, you will need:

  • A copy of the template
    • An A4 (8.5”x11”) copy of the template for each player, or
    • an A0 size copy of the template for the room, or 
    • a digital copy of the template, or 
    •  each player may hand draw their own
  • Pens and markers
  • Post-it notes
  • Camera to capture the results

An example of Even Flow facilitated virtually. Zoom in to see the flow.

How to Play

Step 1: Become aware

  1. Tell the players that we’re going to explore states-of-being or actions that appear to be opposites of one another. 
  2. Ask the players to take a few minutes and silently brainstorm perceived states-of-being or actions, and their opposites. For example: inhaling and exhaling, chaotic office environment and one that’s more structured, an organization that prides itself on innovation but also needs optimization, winter and summer, individual needs vs. those of the community. These opposites might come from personal reflection, or professional experience. 
    1. For additional examples to share, visit https://assessmypolarities.com/ 
  3. Ask the players to make a copy of the template for their personal use – draw it or copy/paste it, depending where you are.
  4. Ask the players to select one pair of opposites to continue with and and place one polarity on each of the sign posts in our framework. Consider using a Dot Vote. 

Step 2: Map the system

  1. Ask the players to take a few minutes to identify the benefits and desired results that might be available through focusing on a particular pole. They can write these on the diagram or use post-it notes (one per thought). Have each player present their post-its to the group.
    1. Repeat for the other pole
  2. Ask the players to take a few minutes to identify the negative consequences that result in overfocusing on a particular pole to the neglect of the opposite pole. They can write these on the diagram or use post-it notes (one per thought). Have each player present their post-its to the group.
    1. Repeat for the other pole

Step 3: Tune in

Assess the current state of the system.  Tune into the flow of energy between the poles.  

  1. Ask the players to label their template by answering the following question and using one thought per post-it note: 
    1. What are you experiencing right now in relationship to either of these poles?
    2. Determine your location on the spatial continuum between the poles.  
    3. What benefits are you seeing?  
    4. Are there any indications that negative consequences are emerging?
  2. Ask the players to present their thoughts to the group.
  3. Remind the group that overfocusing on a particular pole will lead to negative outcomes – avoid the rocks near the shore.  Focus on a pole to realize the benefits – catch some lovely fish! But remember that overfishing has consequences.
  4. As the players to identify which benefits and hazards are alive in the system by highlighting them.  Use both qualitative and quantitative data to guide your responses.

Step 4: Honor the energy

Let the results of the assessment guide behavior and decision-making.  Reduce focus if early signs of negative outcomes emerge.  Move in the other direction.

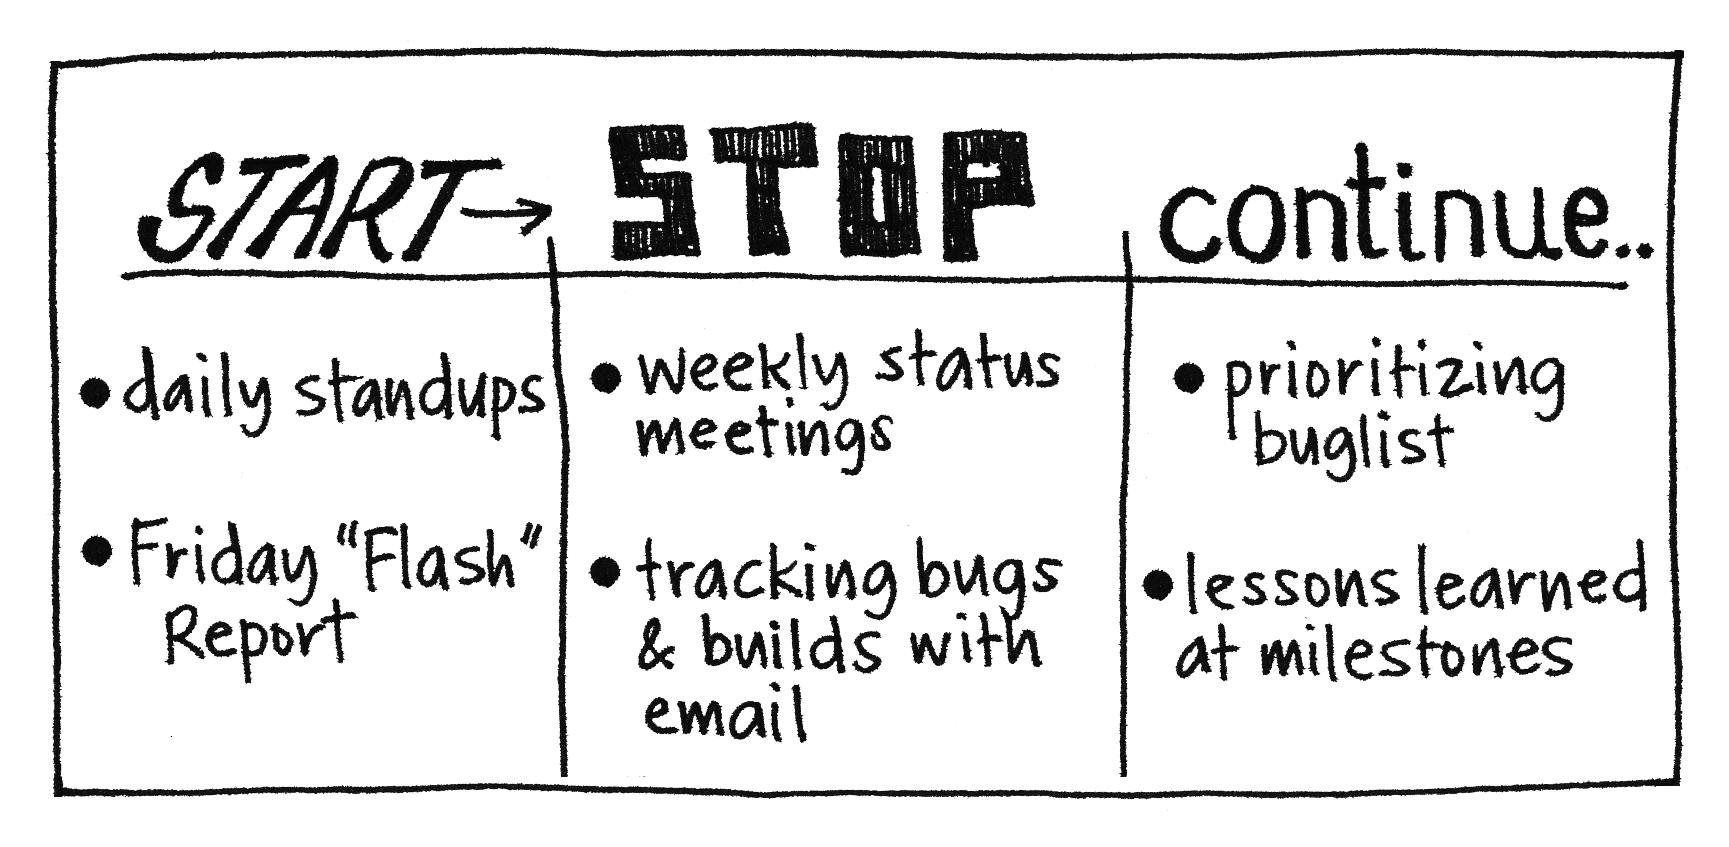
  1. Ask the players to take a few minutes to individually brainstorm what action steps might optimize benefits and reduce risks. What they might Start, Stop or Continue doing? One thought per post-it note. 
  2. Have each player present their thoughts to the group. 

Step 5: Map the future

Use the framework to guide you through future situations that arise within the tension of the polarity.

  1. Set up a monitoring cadence to revisit and reassess the direction of the system.

Strategy
It’s common to view polarities through an EITHER / OR lens, but this methodology works through a BOTH / AND lens (i.e. you need both INHALE and EXHALE). Critical pieces of the strategy include accurately defining the polarities and ensuring that poles are value-neutral.  A breakdown in the system occurs when one pole is devalued and our energy rushes toward the preferred pole.  

In organizations and teams, course corrections may take time to manifest.  Make changes proportionate to the signals received.  Don’t oversteer by making dramatic or violent changes toward the opposite pole when negative outcomes are observed.

Ideally, keep the map visible in the environment.  Communication that includes these visual mapping references will help reinforce the strategy and thinking.

Complementary Games
Friend or Foe – organizational design analysis

Who do – identify what you need from each of your stakeholders

Empathy Map – get inside their heads to understand their pains and gains

Source

Game inspired by Barry Johnson, Polarity Partnerships: https://www.polaritypartnerships.com/

Visual Metaphor by Troy Schubert

Posted on

Bring Your Own Dashboard

For more information

Listen to Michael Schrage, research fellow with MIT Sloan School’s Initiative on the Digital Economy, describe the need for strategic KPIs, common pitfalls organizations encounter when grappling with new technologies and why co-creating dashboards in a workshop setting are fundamental to AI capability development.

The game

Read through your favorite Management publication today and you’re likely to find an article on Artificial Intelligence. One we particularly liked, Strategy For and With AI, clarifies the difference between using AI in your product or service (Strategy *For* AI) and harnessing AI to plan your strategy (Strategy *With* AI). The latter involves a tight coupling of KPIs, Data Governance and Decision rights that few companies can claim – the article recognizes Google, Uber, and GoDaddy. While these case studies may reveal an intimidating gap between their achievement and your organization’s progress, a discussion with article co-author Michael Schrage reveals simple steps any organization can take to move forward on this path.

AI with strategy works best with a strong foundation of established KPIs, mature Data Governance practices and clear Decision Rights
Object of Play

Most teams, regardless of size, can access data measuring their progress towards goals. Use this group activity to validate the strategic alignment of your KPIs, understand the relationships between them, and brainstorm tests you can perform to validate both.

Number of Players

5-15

Duration of Play

90 minutes

How to Play

OPEN

There are two options for opening this game:

Option A

If your participants have defined KPIs or OKRs which they currently measure:

  1. Ask them to bring a sample report or dashboard to the activity
  2. Once gathered in the room, ask each team or individual to briefly present their report, identifying:
    1. Which organizational strategies the report aligns to (OKR)
    2. Report KPIs (OKR)
    3. Other important reporting metrics
  3. Once all the reports have been presented, ask the teams to write down their KPIs and metrics, one per sticky note and put them up on the wall.

Option B

If your participants have less defined measurement and feedback infrastructure OR you’re looking to explore new measures and KPI’s

  1. Inform the players the purpose of the activity is to explore our strategy by creating a dashboard
  2. Write at the top of the whiteboard an organization-wide strategic goal
  3. Ask the players to take five minutes for an individual brainstorm: list all the customer behaviors impacting the strategic objective of your organization. For example,  a digital marketing team may be concerned with: customers signing-up for the newsletter, shoppers visiting your website, follow the brand on Twitter.
  4. At the end of the brainstorm, ask each player to put their sticky notes on the wall, quickly presenting them to the team one-by-one. 
  5. Once all the brainstormed ideas are on the wall, ask the group to organize them into themes. Let the themes emerge organically, i.e. don’t guide or direct their behavior. 
  6. Take 5 minutes to review each theme; ask for the players to briefly explain their thinking and insights. 
  7. For each theme ask the group to identify one or two KPIs that best measure the desired consumer behavior. 

EXPLORE

KPI relationship matrix
A KPI relationship matrix
  1. Let the players know you’re going to explore your KPIs by looking at their relationships to one another. 
  2. Set the board by creating a matrix of the KPIs identified in the Opening. 
  3. To play, the group determines the relationship between each set of KPIs: Direct if an increase in one would cause an increase in the other OR Indirect if an increase in one would cause a decrease in the other.
  4.  A group may choose to write down relationships individually at first and then call out their results on each item and criterion to create the tally. 
  5. Identification should be done quickly, as in a “gut” check.
  6. A discussion after the table has been completed may uncover uncertainties about strategy and KPI maximization. For example, Marketing’s attempt to maximize website visitors may negatively impact Sales’ conversion rate. 
    1. Some questions to prompt: 
      1. What do you notice about these relationships? 
      2. What KPIs should you consider adding? Removing?
      3. Are there instances where KPIs should be optimized instead of maximized?
      4. Are the representative strategies aligned? Do the KPIs indicate any conflicts? 
      5. What other organizations are implicated by these KPIs?
      6. What are we uncertain about? How might we test those uncertainties in the next week?

CLOSE

Based on your discussion perform a Start-Stop-Continue. Ask the group to consider the customer behaviors, KPI relationship mapping and subsequent discussion and individually brainstorm in these three categories:

  1. Start: What are things that we need to START doing?
  2. Stop: What are we currently doing that we can or should STOP?
  3. Continue: What are we doing now that works and should CONTINUE?

Have the individuals share their results.

STRATEGY

In our data-rich world, your strategy is what your KPIs say it is. Teams often try to maximize KPIs in the absence of understanding their impact. This exercise clarifies ripple effects strategies have on each other and surfaces considerations for when Optimization should trump Maximization. 

CREDITS

This game was inspired by David Kiron and Michael Schrage’s MIT Sloan Management Review article, Strategy For and With AI

COMPLEMENTARY GAMES

Posted on

Navigate your market opportunities

Photo by Felix Pilz

Any innovation or technological invention can be applied to serve different types of customers. Understanding your set of market opportunities increases your chances of success: It not only allows you to focus on the most promising market, but also helps you to avoid a fatal lock-in. The Market Opportunity Navigator, developed by Dr. Sharon Tal & Prof. Marc Gruber in their book Where To Play, is a tool that helps you to map out your market opportunities and adopt a broad view of your options, so you can set your strategic focus smartly.

Object of play
Unleash the power of new market opportunities by stepping back from your current product and customer assumptions. The Market Opportunity Navigator offers a structured process for identifying, evaluating and prioritizing potential markets for innovation; examine and rethink your strategic focus or plan your future roadmap. This game provides a shared language to discuss, debate and brainstorm with your team and stakeholders.

Number of players
1-6 players (depending on objective).

You can work individually to sketch out your initial perceptions, but a diverse team is recommended if you want to broaden your view and map out your landscape of opportunities more accurately.

Duration of play
Anywhere between two hours (for a ‘quick and dirty’ process), to two days (for a thorough discussion). In general, the game includes three steps:

Step 1 – Identify Market Opportunity Set
Step 2 – Evaluate Opportunity Attractiveness
Step 3 – Depict Your Agile Focus Dartboard

Material required
To run a good session, you will need:

  • A large print of the Market Opportunity Navigator, preferably on A0 size. A1 – A3 will do the job. Downloadable here
  • Printed copies of Worksheets 1, 2 and 3 preferably on A1 size. A3 – A4 will also work. Downloadable here
    • If you can’t make large prints of the worksheets, it’s OK! You can easily reproduce all the worksheets on flip charts.
  • Flip chart paper with adhesive backing
  • Sticky notes of different colors
  • Markers and pens
  • Camera to capture the results
  • The facilitator of the game can learn more about the process at: www.wheretoplay.co

How to Play
Room Setup: Place the A0-sized Market Opportunity Navigator somewhere in the room. If you don’t have an A0, draw the templates on individual flip charts and hang.

Step 1: Identify a Market Opportunity Set

  1. Begin the game with a clear definition of what a Market Opportunity means. Write on the board: A market opportunity is any application of your abilities for a specific set of customers.
  2. Inform the players we will now explore each.
  3. Ask the players to take five minutes for an individual brainstorm to describe and characterize the core technological elements or unique abilities of the firm in their own right, detached from any current or envisioned application. Write one element or ability per sticky note.
  4. Once the brainstorm is done, have the players to put their notes on the wall. Ask for volunteers to sort the notes into meaningful categories (see Affinity Map). Once finished, ask the sorters to describe their process.
  5. Summarize the unique abilities of the firm and list their functions and properties on the upper part of worksheet 1.
  6. Repeat this process to brainstorm customer problems that can be addressed with these unique abilities. Ask the players to take five minutes for an individual brainstorm and describe customer problems, one per sticky. To broaden their horizon, ask them to think about who else beyond the current customer set might have these problems. What other problems might they have? Encourage players to think wide and broad. There are no ‘wrong ideas’ at this stage.
  7. Once the brainstorm is done, ask the players to put their notes on the wall. Ask for volunteers to sort the notes into meaningful categories (see Affinity Map). Discuss what these categories might mean for your company and products.
  8. With a strong understanding of both the firm’s capabilities and potential customer problems, discuss with the players different applications stemming from these abilities, and different types of customers who may need them. Summarize these on the lower part of Worksheet 1.
  9. At the end of the brainstorm, pick few market opportunities that seem interesting for further consideration. ask the players to briefly describe their idea as they place it on the Market Opportunity section of the Navigator. Use colored sticky notes to represent each of these market opportunities, and place them on the market Opportunity Set section of the Navigator.
  10. Your Market Opportunity Set is now ready.


Step 2: Evaluate Opportunity Attractiveness

At this step, players will assess the potential and the challenge of each opportunity in their set, to compare and prioritize options. Market opportunities are not born equal- some are more attractive than others.

  1. To begin the evaluation process, explain first what an attractive option is. Write on the board: An attractive option is onethat offers high potential for value creation, and limited challenge in capturing this value.
  2. Divide the group into small teams, and assign 1-2 market opportunities to each team.
  3. For each opportunity, ask the teams to assess the overall potential and overall challenge of each option, using the criteria described in Worksheet 2. If you do not have an A1 sized worksheet, recreate the template on a flip chart or use smaller prints.
  4. Once done, let each team present their evaluation to the group, discuss it with the others, and reach agreement. Then placeeach market opportunity (using colored sticky notes) in the mid part of the Market Opportunity Navigator. Your Attractiveness Map is now ready.


Step 3: Depict Your Agile Focus Dartboard

Having multiple options at hand is important for maintaining your agility. In the last step of the game, you can design your Agile Focus strategy.

  1. Begin with a clear explanation, write on the board: An Agile Focus strategy clearly defines your primary focus, the opportunities that you will keep open for backup or future growth, and those that you put aside for now. It will help you balance the ongoing tension between focus and flexibility.
  2. Players should pick attractive opportunities from step 2, and assess their relatedness to the currently pursued market(s),using Worksheet 3. If you do not have an A1 sized print, recreate the template on a flip chart or use smaller prints.
  3. Discuss and pick at least one backup option and one growth option that you want to keep open. Depict your decision (using colored sticky notes) in the right part of the Market Opportunity Navigator. Your Agile Focus Dartboard is now ready.
  4. Discuss the implications of this strategy to your company: How keeping these options open will influence the technology you are developing, the patents you write, the marketing messages you choose etc.


Strategy
This thought process is extremely powerful for companies seeking to understand and leverage their landscape of opportunities. The ‘big picture’ that it provides is especially valuable for:

  • Startups seeking their initial strategic path
  • Companies in need for pivot
  • Companies searching for new growth engines
  • Companies wishing to leverage existing IP

You can play this game to advance solid strategic decisions, but also to nourish and nurture the cognitive flexibility of your team, or simply to develop a culture that is more flexible and receptive to adaptations.

If you use this tool as a structured decision-making process, more time is required for market validation. In this case, you can map out your opportunities, state your assumptions while doing so, and get out of the building to support or refute them. You can then update the Market Opportunity Navigator and reflect on your learning.

Complementary Games
Finally, use the Navigator in combination with other great tools to set a promising strategic path:

  • the Empathy Map will help you to more deeply understand your stakeholders; play this game before exploring new opportunities
  • A quick ride on the Carousel will put players in a brainstorming mindset before exploring
  • Use the Business Model Canvas to further and more managerially flesh out the viability, feasibility and desirability of your newly discovered Market Opportunities

Variations
You can use each step of the Market Opportunity Navigator as a separate game, depending on your objectives. For example:

  • Use step 1 as a game to uncover different applications and target markets
  • Use step 2 as a game to assess the attractiveness of a specific business opportunity that you have in mind, and check out if it’s worth betting on.
  • Use step 3 as a game to develop possible roadmaps for your venture

Source
Prof. Marc Gruber and Dr. Sharon Tal created The Market Opportunity Navigator in their book, Where to Play: 3 Steps to Discovering Your Most Valuable Market Opportunities

Posted on

Manage What You Measure

Measures of success vary across an organization. Executives concern themselves with company-wide Objectives involving Revenue, Cost, Profit, Margin and Customer Satisfaction. Further down the org chart, management and individual contributors rate performance against more detailed Key Performance Indicators (KPIs) tracking customer behavior: a product manager may measure app downloads, or number of shopping cart items per visit. These customer behaviors clearly affect the larger corporate Objectives, but how? and which have the most impact?

Objective of Play
Understand how customer behavior impacts higher level objectives; direct organizational efforts on the most influential of those behaviors.

Number of Players
5 – 15

Invite participants across the KPI spectrum: individual contributors, management and executive leadership. A successful game will demonstrate how all levels of KPI’s relate and affect one another.

Duration of Play
30 minutes – 3 hours.

Material Required
Manage What You Measure works best when played on a whiteboard. To run a good session you will need:

  • Sticky notes (i.e. post-it® notes) of different colors
  • Dot stickers
  • Dry-erase markers
  • Camera to capture results

How to Play

1. With the group gathered, introduce Manage What You Measure by stating that the purpose of the game is to focus resources and strategies on the most critical customer behaviors. To get there, the group will map the relationship between high-level corporate objectives and customer behavior.

2. Write at the top of the whiteboard a corporate-wide Strategic Goal.

3. Below that, write on sticky notes the measures of success (KPIs) for that Strategic Goal. Use different color sticky notes when possible.

4. Ask the players to take five minutes for an individual brainstorm: list all the customer behaviors impacting the KPIs identified in Step 3; one per sticky note. If possible, match sticky note colors of customer behaviors and KPIs — this will help organize what may become a crowded whiteboard.

5. After the brainstorm, ask the players to come to the whiteboard and post their sticky notes under the appropriate grouping.

6. Take 5-10 minutes to review the sticky notes. Lead a clarification discussion. Ask participants to explain any potentially confusing sticky notes. Note any customer behaviors mapped multiple times.

7. Repeat steps 4 – 6 once. Use the first set of brainstormed-customer behaviors as the baseline: what are the behaviors that drive those behaviors?

8. Once everyone is comfortable with the customer behaviors, conduct a Dot Vote. Give each player five dots to place on what they consider the most important customer behaviors in light of the Strategic Goal in step 2.

9. Tally the votes.

10. Once again, take time for discussion. Note unpopular choices; ensure their dismissals have merit. Have any results surprised the group? Why? Recommendation: If the Dot Vote results and ensuing discussion dictate further prioritization, consider playing Impact & Effort or the NUF Test.

11. Once the group agrees on the prioritized areas of focus, assign each a baseline value (what is the measure of this behavior now?) and goal (where would we like it to be). Recommendation: Consider playing Who-What-When

Strategy
Employees understand organizational goals at different levels. By defining relationships between high-level objectives, mid-tier KPIs  and the customer behaviors that drive them you have created a map easily navigated.

This clarity creates a shared understanding across all levels of the organization. Now, each time a team reports progress on their specific KPIs, executives will have a clear sense of why the team is working on that and how it affects the Objectives they care most about.

Complementary Games
The Empathy Map will help you to more deeply understand your customers and their behaviors; play this game before Manage What you Measure

Manage What You Measure derives from Jeff Gothelf’s Medium post: Execs care about revenue. How do we get them to care about outcomes?

Posted on

Cost Benefit

This game, developed by Johan Tré, is most probably the most simple collaborative cost benefit analysis ever.
It is applicable onto subjects where a group has expert knowledge about costs and/or benefits.

A group of developers is such an example.
Especially a customer or customer proxy will have interest when it comes to prioritizing work items.

Generation ideas
If the list of work items is not existent you can start this exercise by a silent post-up.
All individuals in the group start scribbling down about the work to be done. (one thing/sticky)
After 10 min or so ask the group to hang them on the wall.

Clustering
Ask the team to group items together by subject in silence. Items causing discussion you ask to park aside.
Explain that the only purpose is having a priority. So under what cluster it’s been put isn’t that important. What is important however, is all know where it’s under.
So on the exact scope (what-fits-best-where) there is no explicit consensus needed. A majority is fine.

In short:
* does everybody know the scope of the clusters?
* can the team proportionally estimate the size of the scope? (what is bigger/smaller then what)

Priories on cost

SortingCostBenefit-Sorting-Scaling
Next, ask the team to sort them top to bottom on cost. (5 minutes of work)
Park the items under discussion aside after all the others are done.
Discussion can only happen when the clustering did not clear things up or caused friction. This could indicate the team isn’t aware of the goal: putting priority.

Scaling
Next hang the lowest sticky way lower and the highest way higher then the rest of the sorted list.
Like that you’ll have room to position the stickies on a scale.CostBenefit-Y-axis
Write down on the board some marks of the scale.  E.g. (see image): 1, 5, 10, 15, 20.
Ask the team to position the other items on the correct place on the scale.
The sorted order must will stay ofcourse, a relative cost will emerge from the scale as they are positionned.

This all takes about 10 min: Sorting 5, scaling 5.
Depending on the position on the scale, write the relative number bottom left on the stickies.
E.g. stickies in the middle: 50%, top 0%, bottom 100%.
This will be your Y-axis coordinate to put your sticky on a 2D cost -benefit graph.

Priories on benefit

Do the same for the benefits with a product owner, customer if preferred.
Sort, relatively scale them, and write the number bottom right.


Cost Benefit Result

Putting it all together

Draw the X and Y axis with the top and bottom values from the exercise above:  the costs & benefits.
Hang the stickies according to the cost/benefit coordinates noted on them.

The low hanging-fruit and infeasible-expensive items are clearly found now.


Conclusion

Note that the same approach can be done with a Kano diagram or any other kind of 2D graph.
It’s a fun way of clearing things out and prioritizing is done through collaborative support.
Special attention on discussion starters is recommended. They are the time consumers, and can be stopped by guarding and communicating your goal: prioritizing.

Enjoy this game, feedback is mostly appreciated!

Source
This game was developed and originally authored by Johan Tré.


Posted on

35

Object of Play

This game has been designed to help prioritize different ideas or items in a quick and energetic way without getting stuck in endless discussions and avoiding any kind of influencing. It is similar to 20-20 game as it will compare items in pairs.

Number of players: 4 – 50

Duration: 15-45 minutes depending on the group size and items at hand.

How to play

  1. Organize or facilitate another game to generate items that require prioritization.
  2. Ask all attendees to put the items at hand in the middle of the group of people, one by one and shortly explaining the item at hand.
  3. When all items are in the middle of the group let each one of the attendees select their “Top”, “Most Important” item out of the pile and do this one person at the time. If their top item is gone then they could take their second, third… option out of the list, purpose it that everybody has 1 card at hand. (With a small group let them take 2).
  4. Now instruct the people to mingle amongst each other and find a partner in order to form pairs. Shortly discuss how to spread 7 points amongst the 2 items at hand with the 2 of them and add those points on the back of the card.
  5. Let the people take each others card and find another partner for a second round of weighting cards with each other.
  6. Do this 5 times (5 times 7 = 35)!
  7. Summarize all different weights to a single figure and sort highest number on top and so on…

Note: Even when the group does this a second time with the same items and interest at hand the sorting will be the same but figures might differ a bit.

Strategy

Getting a group consensus about priorities between different related items is not easy and 35 will give them an easy way to effectively and repeatedly prioritize items according the groups consensus. The technique is build in such a way that people can not cheat the system and influence the outcomes as you compare, weight items related to each other. By constantly changing cards from hands and switching from partners one is can never influence the outcome. A great way to achieve a fast consensus about the priority of the items at hand.


Posted on

What could go wrong?

This post written by guest author Clifton B. 

A while back I was working with a friend’s startup, building a web app that helps small businesses connect with their customers without having to pay for dedicated customer service teams. Still in the proof-of-concept stage, the developers had been wondering whether to introduce a handful of premium services to their product for a some time, but didn’t know how they should decide whether or not to take that leap.

(Because this startup is still a little stealth, I’m not allowed to say who it is, or much more than the description above. But that should be enough for this article.)

I tackled this problem by combining two activities I’d recently learned about, one from Gamestorming, which had just left the presses, and one my friends Barbara Holmes and Jeanne Turner at ISITE Design had been polishing and presenting at various meetings and IxDA events: user journeys.

Walking EVERY mile  in your user’s shoes

Considering each step your users will take toward a desired outcome—from awareness of the product or service to becoming a loyal customer—is instrumental in design a pleasant experience, as Barb points out in her article, Mapping the Customer Journey. The customer (or user) journey is a great way to visualize real-life scenarios that could potentially stand in the way between winning and losing a potential user.

But this wasn’t just about designing a great experience. It was about determining whether we should even start building a premium tier to validate a paid service. So I turned to Gamestorming, and found the Pre-Mortem game, a clever twist on the post-mortem summaries we’re all used to seeing at the end of a project.

Pre-Mortem is a simple, straightforward activity meant to identify potential problems before they happen, and start thinking about how they can be avoided. I decide to combine the concept with the user journey, and came up with something I’m actually pretty proud of.

The cyclical user journey

We decided to walk through the four phases of the user journey we’d identified, Awareness, Consideration, Purchase and Renewal, and came up with reasons throughout our personas’ journeys that might prevent them from becoming happy, loyal customers. We wrote short user stories to illustrate our customers’ desires and concerns along the way.

Cyclical User Journey

Why cyclical? Since this would be a recurring cost to our customer, we would need to make sure we’re addressing her needs even after she decides to start paying for the service. So after the Renewal phase, we revisit Awareness, considering not only new features we’d be implementing, but a shifting roster of competitors as well. You’re never finished selling to your users, even after they’ve paid.

Paving the way to engagement

After laying out the phases of the journey, we came up with reasons why the user would abandon the product at any time. Each cause for lost customers was countered with possible actions we could take to keep them around. While the cyclical journey implies all four phases cycle endlessly, with this diagram we treated the Renewal phase as the point where recurring payments come in, abandoning the cyclical approach for a step-by-step analysis of each phase.

Projected User journey

A quick illustration at each phase shows the path of a happy customer, who decides to stick with the product, and that of a customer who decides to leave before the next phase starts. Every destination has its story, and pinning down the stories that lead to abandonment is the first step in discussing how to better serve your users.

Sticking a fork in it

After determining how much work it would take to keep customers around, the team decided not to go through with this feature set, at least not for now. The service is still young, and while it seemed like an attractive option to have a premium tier with lots of extra features, this exercise convinced us that it wouldn’t be worth the initial investment.

While there’s a chance we could have been the next big thing with this premium tier, I like to think I saved the company a lot of time and money which might have other wise been wasted on this effort. We’re still on the lookout for a feature set that will be worth the effort and might pay off in the long run, but it’s good to know that we haven’t sunk a bunch of time and money into one with such a low chance of success.

Now that I’m running my own startup, Revisu, it’s important to me and my co-founder that we see as far as we can down the journey our users will take in becoming loyal customers, identify potential roadblocks, and deal with them before anyone actually reaches them. Hopefully, if we smooth that road out ahead of time, we’ll have much happier customers in the long run.

Posted on

20/20 Vision

Object of Play

The 20/20 Vision game is about getting group clarity around which projects or initiatives should be more of a priority than others. Because employees’ attention is so often divided among multiple projects, it can be refreshing to refocus and realign more intently with the projects that have the biggest bang for the buck.  And defining the “bang” together helps ensure that the process of prioritization is quality.

Number of Players

5–10

Duration of Play

30 minutes to 1.5 hours

How to Play

  1. Before the meeting, write any proposed project or initiative relevant to the players on sticky notes, one item per note.  And when you begin, it’s important that the initiatives you’ve written on the sticky notes are posted in random order during both stages of the game.  Shuffle them before the meeting starts—you can even blind-post or ask a player to post—so that from the onset there is no implicit prioritization on your part.
  2. Introduce the game by explaining to the players that 20/20 Vision is about forced prioritization based on perceived benefits. Verbalize the importance of building consensus on priorities to move the organization forward.
  3. In a wall space visible to the players, post an initiative and ask the players to describe its benefits. Write their descriptions on a sticky note posted next to that initiative. If there’s disagreement around the benefits of an initiative, write down both or all of the points made. Assume that there’s validity to multiple perspectives and let the group indicate the majority perspective through the ranking process. If the group already has a shared sense of the benefits for each initiative, don’t spend a lot of time clarifying them. Just move into prioritization and respond to questions around benefits as they organically come up.
  4. Repeat step 3 for all relevant projects or initiatives until the benefits have been thoroughly described by the players, captured on sticky notes and posted.
  5. Ask the players if any initiatives are missing from the wall. If so, request that they write them down, post them, and discuss their benefits so that you can capture them.
  6. Move into a neighboring wall space, pull down two random initiatives and ask the players which they can agree are more or less important to the organization’s vision or goals.
  7. Post the one that the group generally agrees is more important above the one they generally agree is less important.
  8. Move another initiative into the new space. Ask the players if it is more or less important than the two posted and post it accordingly—higher priorities at the top, lower priorities at the bottom.
  9. Repeat this process until all initiatives have been thoroughly discussed and prioritized.

Strategy

20/20 Vision is about asking players to thoughtfully evaluate priorities as a group. The first phase of the game—describing and capturing the benefits—is significant because it lays the groundwork for the hard part: determining priorities. It can be challenging to get a group to rank its projects, all of which seem important in some way.

The game works best if you can facilitate general agreement around the benefits and resist the temptation to let the group waffle on prioritizing. They must make the hard decisions. And when the going gets tough, take heart: the players who resist ranking the most may also offer a wealth of insight into the initiatives and ultimately help the players better refine the final ranking.

20/20 Vision is based on and adapted from the same-named activity in Luke Hohmann’s book, Innovation Games: Creating Breakthrough Products Through Collaborative Play.

Posted on

NUF Test

Object of Play

As a group is developing ideas in a brainstorming session, it may be useful to do a quick “reality check” on proposed ideas. In the NUF Test, participants rate an idea on three criteria: to what degree is it New, Useful, and Feasible?

Number of Players

Small group

Duration of Play

Short; 15–30 minutes, depending on the size of the group and the level of discussion

How to Play

Set up the game by quickly creating a matrix of ideas against the criteria:

  • New: Has the idea been tried before? An idea will score higher here if it is significantly different from approaches that have come before it. A new idea captures attention and possibility.
  • Useful: Does the idea actually solve the problem? An idea that solves the problem completely, without creating any new problems, will score better here.
  • Feasible: Can it be done? A new and useful idea still has to be weighed against its cost to implement. Ideas that require fewer resources and effort to be realized will score better here.

To play, the group rates each idea from 1 to 10 for each criterion and tallies the results.  A group may choose to write down scores individually at first and then call out their results on each item and criterion to create the tally. Scoring should be done quickly, as in a “gut” check.

A discussion after the scores have been tallied may uncover uncertainties about an idea or previously under rated ideas. The group may then choose to make an idea stronger, as in “How do we make this idea more feasible with fewer resources?”

Strategy

The goal of this game is to check big ideas against the realities they will face after the meeting is over. It is not intended to “kill” good ideas, but to identify possible weak points so that they can be shaped and improved before seeing the light of day.

The NUF Test is an adaptation of a testing process used for patents.

Posted on 2 Comments

Start, Stop, Continue

a three column chart, with headings START, STOP, CONTINUE

Object of Play

The object of Start, Stop, Continue is to examine aspects of a situation or develop next steps.

Number of Players

1–10

Duration of Play

10 minutes to 1 hour

How to Play

Ask the group to consider the current situation or goal and individually brainstorm actions in these three categories:

  • Start: What are things that we need to START doing?
  • Stop: What are we currently doing that we can or should STOP?
  • Continue: What are we doing now that works and should CONTINUE?

Have individuals share their results.

Strategy

This exercise is broad enough to work well as an opening or closing exercise. It’s useful in framing discussion at “problem-solving” meetings, or as a way to brainstorm aspirational steps toward a vision.

The source for the Start, Stop, Continue game is unknown.